Cross-sectional studies: you collect, we do the rest.
What it is
One snapshot, properly designed.
A cross-sectional study measures a population at one point in time, how common a condition, behaviour, or attitude is, and what it is associated with. It is the most accessible original study for a clinician: no follow-up, no intervention, often no more than a validated questionnaire and access to patients or colleagues. What separates a citable one from a rejected one is the design: a justified sample size, a validated instrument, a sampling plan that avoids bias, and an analysis that goes beyond percentages.
What it is built for
You provide, access to the patients, staff, or students, and the data collection using the tool we build.
We provide, the question, protocol, ethics package, validated questionnaire or CRF, sample size, analysis, manuscript, and submission.
Designs, prevalence and descriptive surveys, KAP studies, diagnostic yield, associations with regression.
How it works
The method, in plain terms.
Frame the question
Population, outcome, exposures
Instrument
Validated questionnaire or CRF
Sampling & size
Powered, bias-aware plan
You collect
Paper, REDCap, or online form
Analysis
Weighted estimates, regression
Report
STROBE / CROSS checklists
How you benefit
Why authors start here.
- The most accessible original study. No follow-up, no intervention, a questionnaire and access to a population.
- Weeks, not years. Data collection is the only clock; everything else is ready before and after.
- Designed to survive review. Sample size, validated instrument, and regression, not just percentages.
- You stay the author. You own the population and the data; we do the methods with you to ICMJE standards.
The project, step by step
How a cross-sectional study runs with Cohira.
Scope the question
We turn your idea into a measurable prevalence or association question.
Protocol, tool & ethics
Protocol, sample size, validated questionnaire or CRF, and the IRB package.
You collect the data
With the form we build. REDCap, online, or paper, and a short training call.
Analysis
Cleaning, descriptive estimates, and regression,.
Manuscript
STROBE-reported paper drafted with you, formatted to the target journal.
Submit & revise
Journal shortlist, submission package, and reviewer responses to a decision.
Published examples
What cross-sectional studies look like in print.
Independent, peer-reviewed examples of what this route can produce.
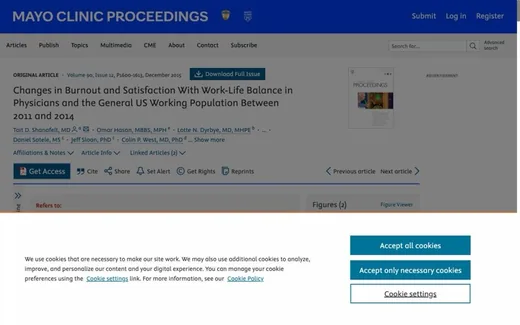
Changes in burnout and satisfaction with work-life balance in physicians, 2011 to 2014
Shanafelt TD, et al. · 2015
A questionnaire-based survey of 6,880 US physicians that became the reference point for physician-burnout research.
View in journal →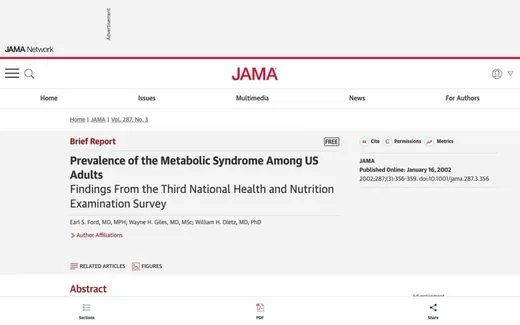
Prevalence of the metabolic syndrome among US adults
Ford ES, et al. · 2002
Cross-sectional analysis of NHANES III, one of the most-cited prevalence estimates in medicine.
View in journal →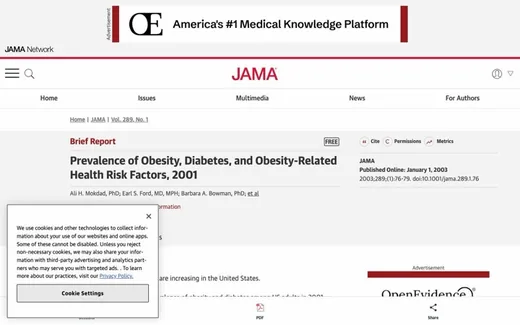
Prevalence of obesity, diabetes, and obesity-related health risk factors, 2001
Mokdad AH, et al. · 2003
A telephone survey of 195,005 adults showing how a well-designed cross-sectional study shapes public-health policy.
View in journal →These are independent published studies, shown to illustrate the route, they are not Cohira's work.
Pricing
One fee, from idea to publication.
The fee covers
- Protocol, and registration or ethics submission where the design requires it
- The data-collection instrument, and the analysis
- Journal-ready manuscript, figures, and supplements
- Journal shortlist and the full submission package
- Reviewer responses, every round, to a decision
- A named lead and a second internal reviewer
Billed separately
- Journal fees and APCs, at cost
- Database access or licences, at cost
- Optional Acceptance Guarantee, offered at quotation
Per project, never per author. You collect the data with the tool we design; everything else is included. Scope and timeline are fixed in the free feasibility note before you pay. Discounts & Acceptance Guarantee →
Start a conversation
Have a population you can survey?
Tell us the group and the question. You get a free feasibility note, design, sample size, and realistic journals, before you commit.