How good is the test, across every study?
What it is
Sensitivity and specificity, pooled the right way.
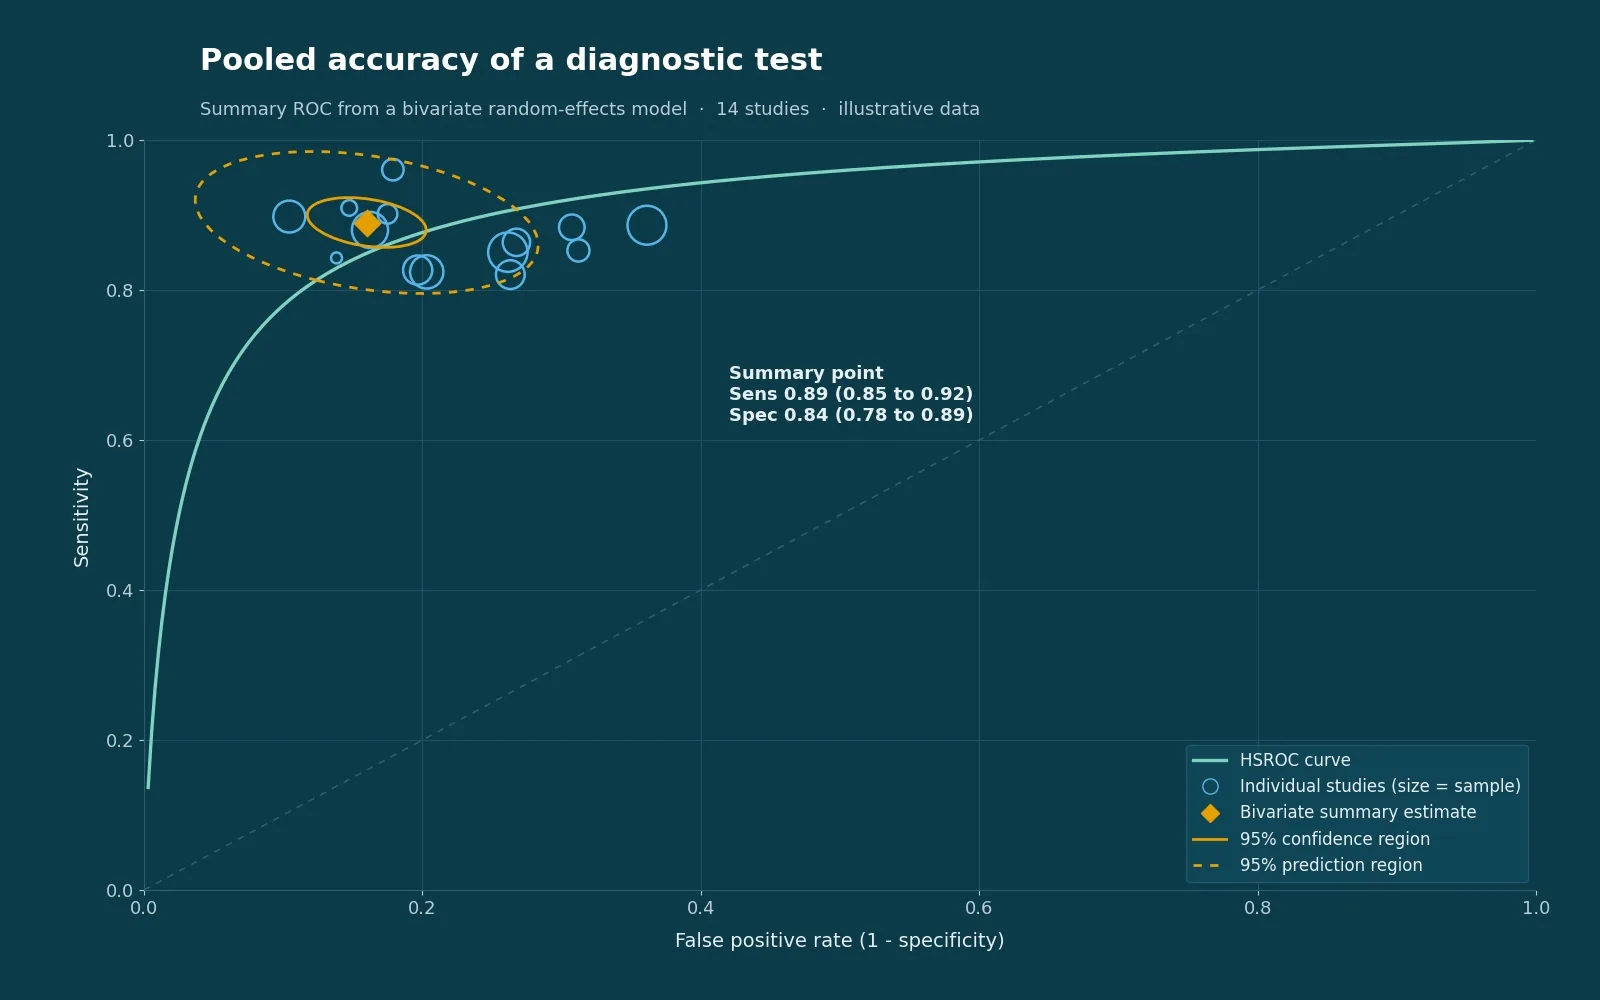
Diagnostic studies report two linked numbers, sensitivity and specificity, and pooling each on its own gives the wrong answer. A diagnostic test accuracy meta-analysis fits a bivariate or HSROC model that keeps them together, draws the summary ROC curve, and turns it into post-test probabilities a clinician can use.
What we run
Bivariate and HSROC models, the Cochrane-recommended methods, fitted in R or Stata with model diagnostics.
QUADAS-2, risk of bias and applicability judged by two reviewers for every study.
Threshold and spectrum effects, meta-regression and subgroups for cut-offs, reference standards, and populations.
Clinical meaning, likelihood ratios, Fagan nomogram, Deeks' test, and PRISMA-DTA reporting.
How it works
The method, in plain terms.
Protocol
PROSPERO, PRISMA-DTA
Search
Databases, no DTA filters
Screen & extract
2 x 2 tables, two reviewers
QUADAS-2
Bias and applicability
Model
Bivariate, HSROC
Interpret
Likelihood ratios, GRADE
How you benefit
Why a test deserves its own meta-analysis.
- Two numbers, one answer. A pooled sensitivity and specificity, with the trade-off between them modelled rather than ignored.
- Useful at the bedside. Post-test probabilities and likelihood ratios tell clinicians what a positive or negative result means.
- Wanted by imaging, laboratory, and cardiology journals. Diagnostic questions are common, well-done syntheses of them are rare.
- No new patients. Every evaluation already published becomes part of your answer.
The project, step by step
How a diagnostic accuracy meta-analysis runs with Cohira.
Scope the question
We define the index test, the reference standard, the target condition, and the setting, and check enough studies exist.
Protocol & PROSPERO
We write and register the protocol with the models and subgroups fixed in advance.
Search, screen, extract
We run the search, screen in duplicate, and extract the 2 x 2 tables with a full audit trail.
Model
We fit the bivariate and HSROC models, check thresholds and spectrum, and derive likelihood ratios.
Manuscript
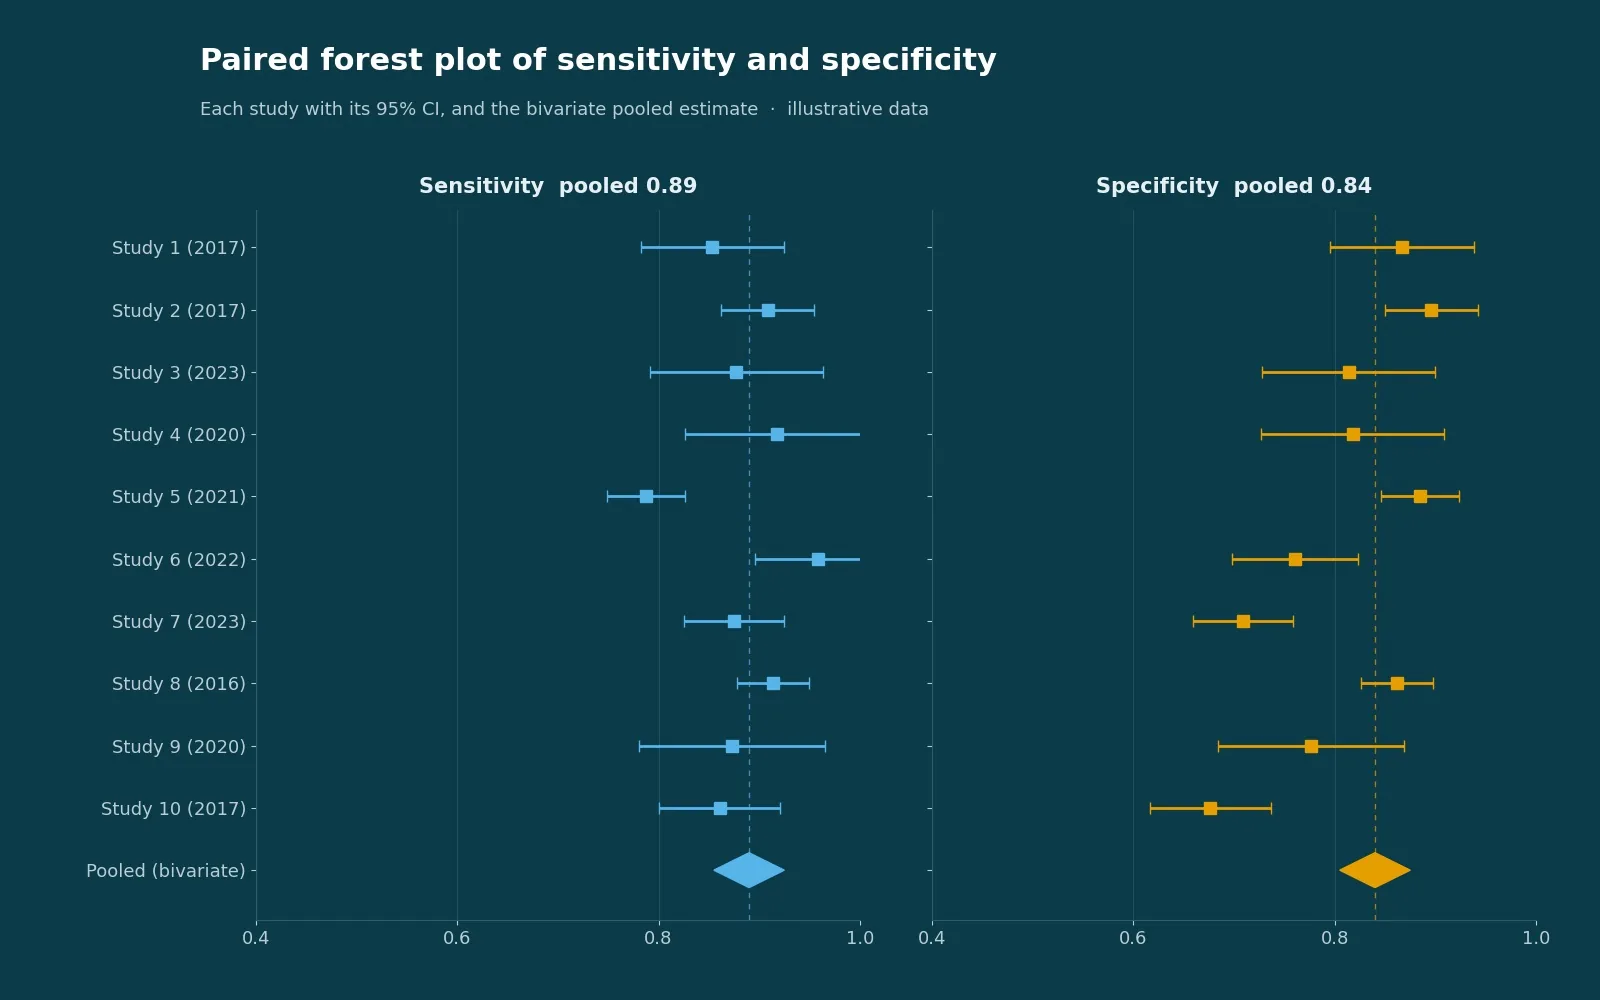
We draft the PRISMA-DTA paper with you: summary ROC, paired forest plots, nomogram, and an honest discussion.
Submit & revise
We pick the target journal, submit, and answer reviewers with you through to a decision.
Published examples
Our diagnostic accuracy work, in the literature.
A peer-reviewed diagnostic test accuracy meta-analysis co-authored by our researchers, in an indexed journal.
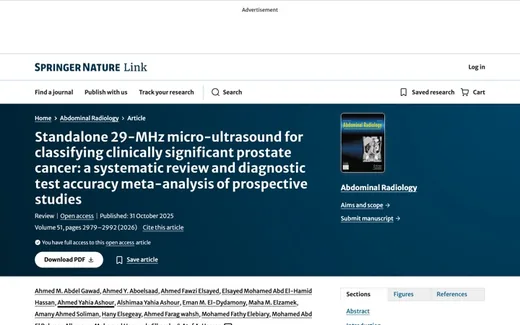
Standalone 29-MHz micro-ultrasound for clinically significant prostate cancer: a diagnostic test accuracy meta-analysis
Abdel Gawad AM, Aboelsaad AY, et al. · 2025
Bivariate and HSROC models, Fagan nomogram, and meta-regression for threshold and spectrum effects.
View in journal →These are peer-reviewed papers co-authored by our researchers. A fuller list is available on request.
Pricing
One fee, from idea to publication.
The fee covers
- Protocol, and registration or ethics submission where the design requires it
- Search, dual screening, extraction, and the analysis
- Journal-ready manuscript, figures, and supplements
- Journal shortlist and the full submission package
- Reviewer responses, every round, to a decision
- A named lead and a second internal reviewer
Billed separately
- Journal fees and APCs, at cost
- Database access or licences, at cost
- Optional Acceptance Guarantee, offered at quotation
Per project, never per author. Scope and timeline are fixed in the free feasibility note before you pay. Discounts & Acceptance Guarantee →
Start a conversation
Have a test worth pooling?
Tell us the test and the condition. We will tell you honestly whether the published studies can support a strong accuracy meta-analysis, and how we would build it.