The burden of any disease, anywhere.
What it is
The world's health, measured and modeled.
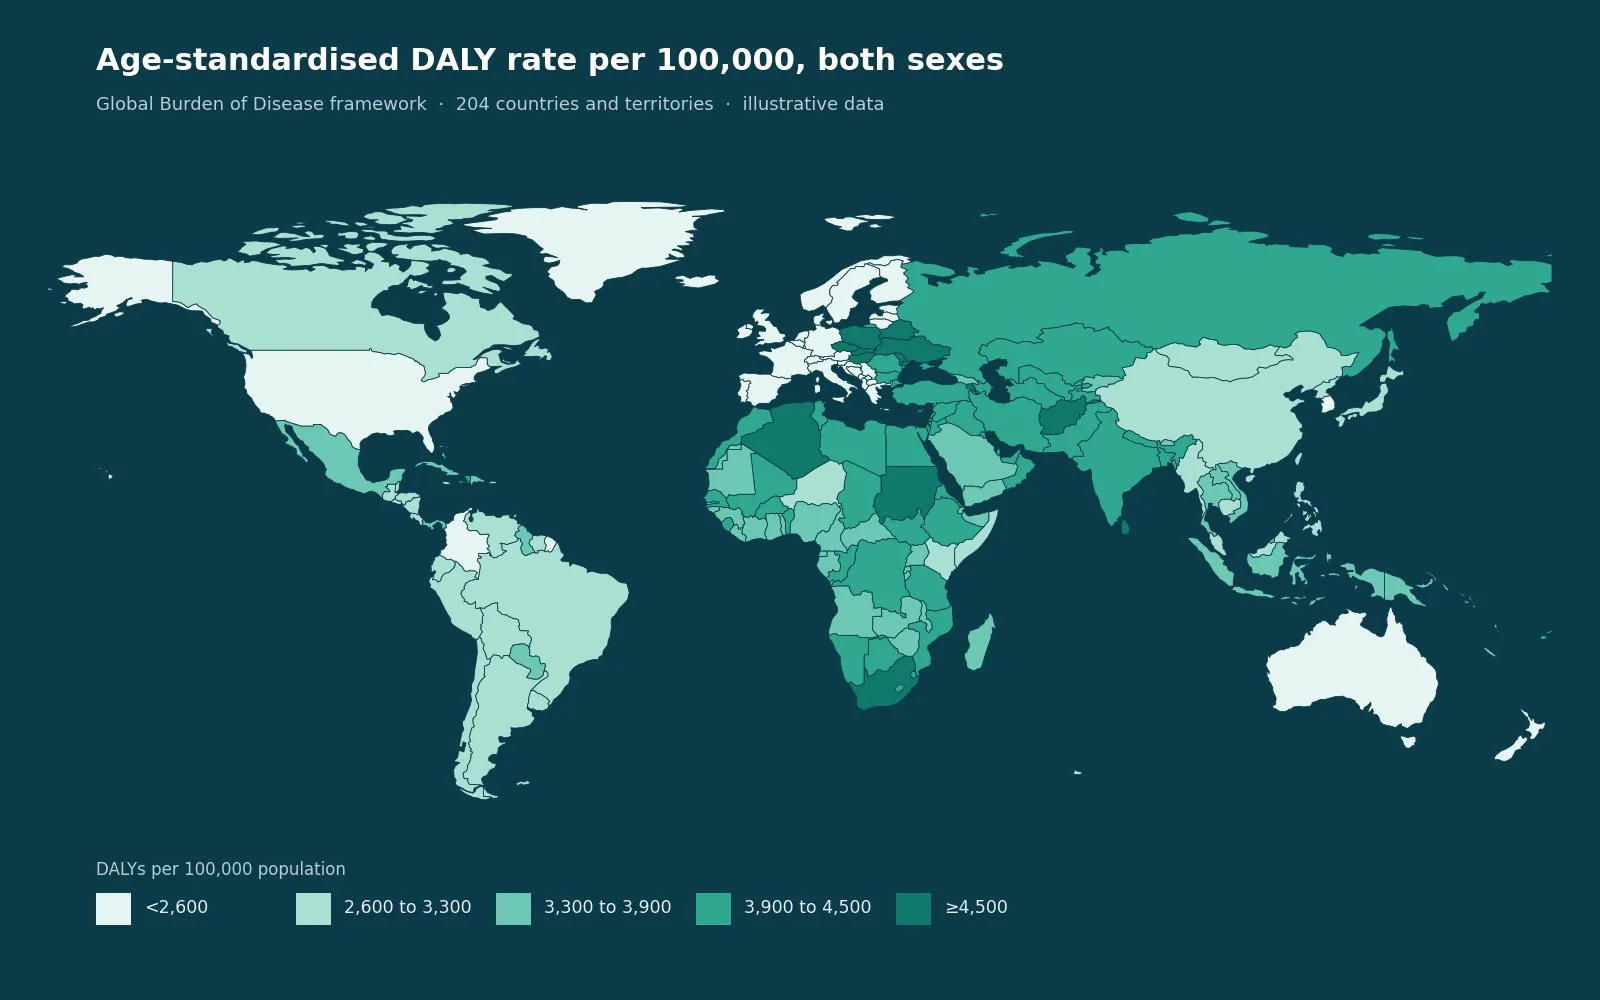
The Global Burden of Disease (GBD) study, coordinated by the Institute for Health Metrics and Evaluation (IHME) and published in The Lancet, is a systematic synthesis of thousands of data sources. It estimates incidence, prevalence, deaths, disability-adjusted life-years (DALYs), and risk-attributable burden for hundreds of conditions across 204 countries and many subnational locations, updated in cycles (most recently GBD 2021).
What it is built for
Scope, hundreds of diseases and injuries across 204 countries, 1990 onward.
Design, descriptive burden, decomposition, joinpoint trend, projection (to 2050), and risk-factor attribution analyses.
Note, figures are modeled estimates, not raw counts; interpretation should respect that.
How it works
The method, in plain terms.
Burden question
Disease, locations, years
Pull estimates
Incidence, deaths, DALYs
Risk factors
Attributable burden
Trends & decomposition
Joinpoint; ageing vs growth
Projections
To 2050, with maps
Honest framing
Uncertainty intervals stated
How you benefit
Why authors start here.
- Global reach, instantly. Describe a disease across countries and decades without collecting any data.
- High-visibility topics. Burden and disparity papers are timely, citable, and policy-relevant.
- No patients, no ethics delay. Publicly available estimates mean a fast route to publication.
- You stay the author. We build the analysis and manuscript with you to ICMJE standards.
Scope the question
We define the disease, locations, and angle that make a publishable burden story.
Define the extract
We specify exactly which GBD measures, years, and groups the paper needs.
Pull & structure data
We extract the estimates and organize them for analysis and figures.
Analysis & visuals
We compute trends and comparisons and build maps and figures in R.
Manuscript
We draft a clear paper with you, figures, tables, and uncertainty reported honestly.
Submit & revise
We target the right journal, submit, and answer reviewers with you to a decision.
Published examples
What GBD studies look like in print.
Peer-reviewed studies built on GBD data, shown to illustrate the kind of question and journal this database supports.
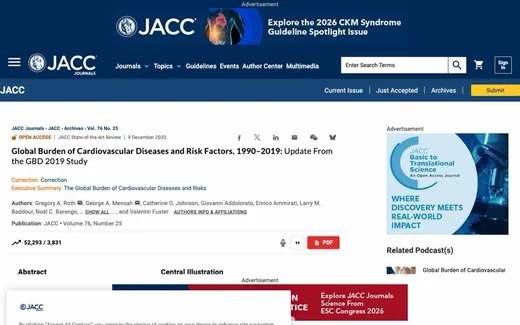
Global burden of cardiovascular diseases and risk factors, 1990 to 2019
Roth GA, et al. · 2020
GBD estimates compared across 204 countries and three decades, the template for a regional cardiovascular burden paper.
View in journal →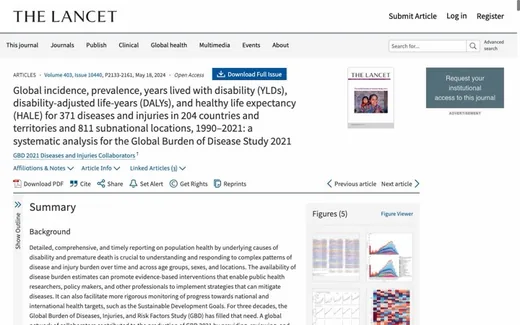
Global incidence, prevalence, YLDs, DALYs and HALE for 371 diseases in 204 countries, 1990 to 2021
GBD 2021 Diseases and Injuries Collaborators · 2024
The canonical GBD 2021 results, quantifying disease and injury burden worldwide and COVID-19's disruption of prior gains.
View in journal →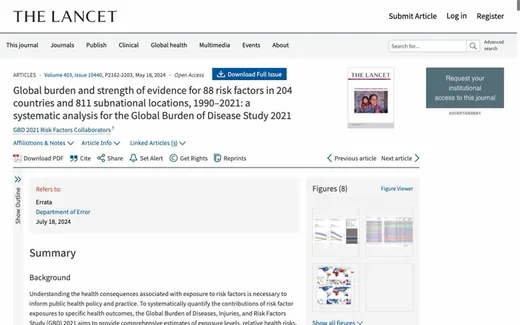
Global burden and strength of evidence for 88 risk factors in 204 countries, 1990 to 2021
GBD 2021 Risk Factors Collaborators · 2024
Ranked 88 risk factors globally, identifying air pollution and high systolic blood pressure as leading contributors.
View in journal →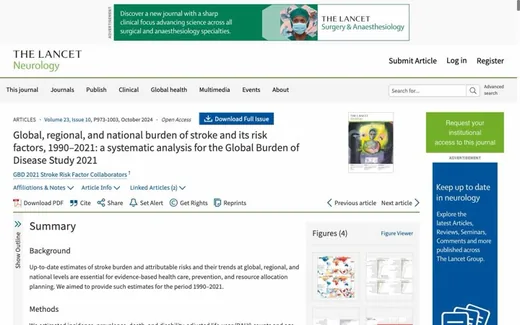
Global, regional, and national burden of stroke and its risk factors, 1990 to 2021
GBD 2021 Stroke Risk Factor Collaborators · 2024
Found stroke the third leading cause of death globally, with rising metabolic and environmental risk contributions.
View in journal →These are independent published studies, shown to illustrate what GBD data makes possible, they are not Cohira's work. We help you design and publish studies of comparable rigor.
Pricing
One fee, from idea to publication.
The fee covers
- Protocol, and registration or ethics submission where the design requires it
- Dataset work and the pre-specified analysis
- Journal-ready manuscript, figures, and supplements
- Database access, included in the fee
- Journal shortlist and the full submission package
- Reviewer responses, every round, to a decision
- A named lead and a second internal reviewer
Billed separately
- Journal fees and APCs, at cost
- Optional Acceptance Guarantee, offered at quotation
Per project, never per author. Scope and timeline are fixed in the free feasibility note before you pay. Discounts & Acceptance Guarantee →
Start a conversation
Want to map a disease burden?
Tell us the condition and the population you care about. We will tell you honestly whether GBD can support a strong paper, and how we would build it.